
How Standardized Downtime Data Improves Root Cause Analysis
When a piece of equipment repeatedly fails, the natural question is:
Why does this keep happening?
Root cause analysis is intended to answer that question. But the quality of an investigation depends heavily on the information available to the people performing it.
If downtime records are inconsistent, vague, or structured differently from one event to the next, investigators may spend significant time reconstructing what happened before they can begin determining why it happened.
Standardized downtime data changes that.
By consistently identifying where an event occurred, what was observed, what component failed, and how it failed, organizations can create a much stronger foundation for root cause analysis.
Root Cause Analysis Starts Before the Investigation
Root cause analysis is often treated as something that begins after a major failure.
In reality, the information needed for a good investigation begins accumulating much earlier.
Every downtime event can contribute evidence:
Which equipment stopped?
What did the operator observe?
Which subsystem was involved?
What component was eventually identified as failed?
How did the component fail?
How long did the event last?
Has the same type of event occurred before?
If these details are captured consistently, historical downtime records become a valuable source of evidence.
If they are not, the investigation may begin with incomplete or fragmented information.
The Problem With Unstructured Downtime Records
Consider several downtime records for the same piece of equipment:
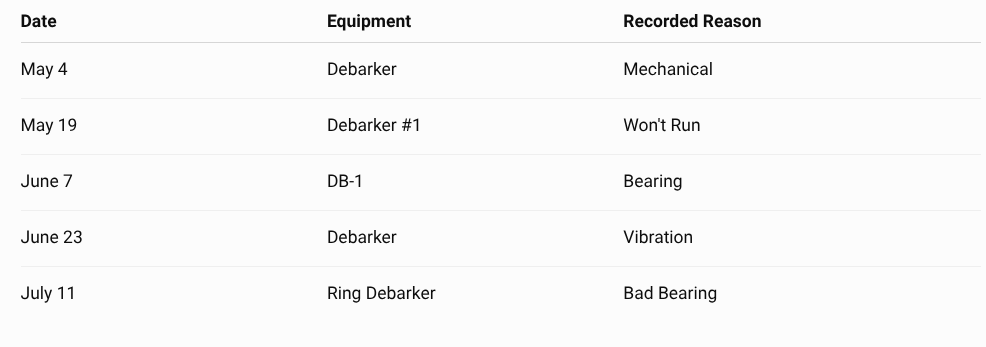
A person reviewing these records may suspect that some of the events are related.
But the dataset does not clearly establish that relationship.
The equipment itself has multiple names.
The reason field contains several different kinds of information:
Mechanical is a broad category.
Won't Run describes an equipment condition.
Bearing identifies a component.
Vibration describes an observable behavior.
Bad Bearing combines a component with an imprecise description of its condition.
The problem isn't necessarily that the information is false.
The problem is that different dimensions of the event are being recorded in the same field.
That makes patterns difficult to identify reliably.
Standardization Separates the Questions
A stronger downtime structure separates these concepts instead of forcing them into one reason field.
For example:
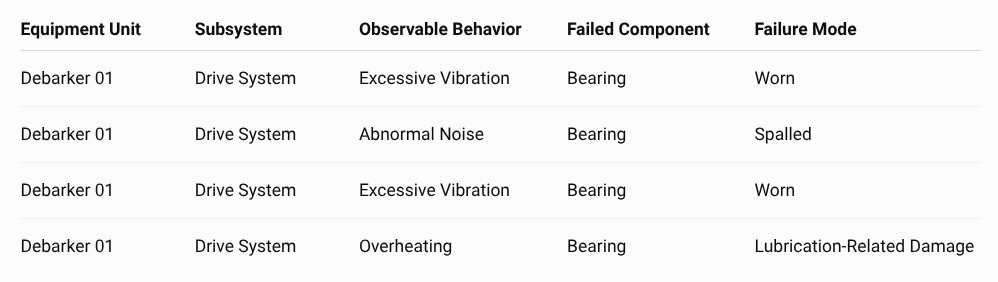
Now each field answers a different question.
Equipment Unit: Where did the event occur?
Subsystem: Which functional portion of the equipment was involved?
Observable Behavior: What was observed?
Failed Component: What physical component was determined to have failed?
Failure Mode: How did that component fail?
That distinction is important because these are not interchangeable pieces of information.
A bearing is not a failure mode.
Excessive vibration is not a failed component.
And "mechanical" does not tell an investigator enough about either one.
Structured Data Makes Patterns Easier to See
Suppose a reliability engineer is investigating repeated failures on a debarker drive.
With inconsistent records, searching the history might require looking for:
Bearing
Bad bearing
Brg
Vibration
Shaking
Mechanical
Drive issue
Loud noise
Even then, relevant events could be missed.
With standardized terminology, the engineer could filter directly for:
Equipment Unit: Debarker 01
Subsystem: Drive System
Failed Component: Bearing
The historical population becomes much easier to identify.
The engineer could then examine the failure modes and observable behaviors associated with those events.
Perhaps the data shows:
12 bearing failures in 18 months
8 classified as worn
3 classified as spalled
1 undetermined
excessive vibration recorded in 9 of the 12 events
That does not automatically identify the root cause.
But it gives the investigation something extremely valuable:
a pattern worth investigating.
Standardized Data Does Not Replace Root Cause Analysis
This distinction is important.
Structured downtime data should not be treated as an automated root-cause determination.
A field labeled Failure Mode: Worn does not explain why the bearing became worn.
A bearing might experience abnormal wear because of:
misalignment,
inadequate lubrication,
contamination,
improper installation,
excessive loading,
shaft problems,
incorrect fits,
operating conditions,
or another underlying mechanism.
Those questions still require engineering investigation.
Standardized downtime data does something different.
It helps investigators identify where to look.
Instead of beginning with hundreds of loosely described downtime events, the investigator begins with an organized history of relevant events.
Failure Mode Is Not Root Cause
This is another distinction that can significantly improve reliability data.
Consider:
Failed Component: Bearing
Failure Mode: Spalled
Spalling describes the physical failure of the bearing surface.
It does not explain why the spalling occurred.
The investigation may eventually determine:
Physical Cause: Lubricant contamination
And further investigation might identify:
Systemic Cause: Inadequate contamination-control practices during lubrication
The information progresses from:
What was observed?
↓
What failed?
↓
How did it fail?
↓
Why did it fail?
Those are different levels of information.
Keeping them separate prevents a failure mode from being mistaken for a root cause.
Better Data Helps Define the Investigation
One of the first challenges in root cause analysis is deciding which events belong in the investigation.
Imagine an equipment unit experienced 60 downtime events during the previous year.
Only 14 involved the drive system.
Of those, nine involved bearings.
Seven of those nine involved the same failure mode.
That progression helps narrow the problem:
60 equipment events
↓
14 drive-system events
↓
9 bearing failures
↓
7 recurring failure-mode events
The investigation is no longer examining "debarker downtime."
It is examining a much more specific recurring failure pattern.
That creates a better problem statement.
And better problem statements generally lead to more focused investigations.
Standardization Improves Pareto Analysis
Root cause investigations are often triggered by Pareto analysis.
But a Pareto chart is only as useful as the categories behind it.
Consider a downtime dataset containing:
Mechanical
Bearing
Won't Start
Electrical
Broken
Conveyor
Motor
Overheated
A Pareto chart can still be created from those values.
The chart may even look professional.
But the categories mix systems, components, behaviors, failure modes, and broad classifications.
The problem is not the chart.
The problem is the taxonomy underneath the chart.
With standardized fields, separate Pareto analyses become possible.
For example:
Downtime by Equipment Unit
Which assets account for the most downtime?
Downtime by Observable Behavior
What conditions are operators seeing most frequently?
Failures by Component
Which components fail most frequently?
Failures by Failure Mode
How are those components failing?
Each analysis answers a legitimate question.
That gives reliability teams a much stronger basis for deciding where deeper investigation is justified.
Better Historical Evidence Improves Root Cause Analysis
A root cause investigation rarely depends on one piece of evidence.
Investigators may use:
operator interviews,
maintenance work orders,
photographs,
vibration data,
oil analysis,
inspection findings,
process conditions,
drawings,
failed parts,
maintenance history,
and downtime records.
Standardized downtime data strengthens one part of that evidence chain: event history.
Instead of relying primarily on memory—
"I think we've had this problem several times."
—the investigator can ask:
How many times?
On which equipment?
Which components were involved?
What failure modes were documented?
What behaviors occurred before the failures?
That moves the conversation from anecdotal experience toward evidence-supported investigation.
Standardization Also Improves Decisions After the RCA
The value continues after the root cause has been identified.
Suppose an investigation determines that recurring bearing failures are associated with lubricant contamination.
The organization implements corrective actions.
How will it know whether those actions worked?
Historical data provides the baseline.
The reliability team can monitor:
bearing failure frequency,
associated failure modes,
downtime duration,
MTBF,
recurring observable behaviors,
and repair frequency.
If the same data structure continues to be used after implementation, the organization can compare performance before and after the corrective action.
That creates a feedback loop:
Standardized Event Data
↓
Pattern Identification
↓
Root Cause Analysis
↓
Corrective Action
↓
Continued Standardized Data
↓
Verification of Results
This is where maintenance data becomes more than documentation.
It becomes part of the reliability improvement process.
The Goal Is Not More Data
Standardization does not mean asking operators and technicians to document everything imaginable.
More fields do not automatically produce better information.
The goal is to capture the right information at the appropriate stage of the event.
An operator may know:
The equipment failed to start.
The operator may not know:
The motor contactor failed because its contacts were severely worn.
That determination may come later from maintenance.
A good data structure respects that difference.
Operators capture what they can reliably observe.
Maintenance personnel add technical findings after troubleshooting.
Reliability personnel can then use the structured history for analysis.
This helps avoid forcing people to guess at information they do not yet know.
From Downtime Records to Reliability Intelligence
A downtime record can be treated simply as documentation that production stopped.
Or it can become part of a larger reliability dataset.
The difference is structure.
When equipment names, observable behaviors, components, and failure modes are standardized, individual downtime events become easier to compare.
When events can be compared, patterns become easier to identify.
When patterns become visible, root cause investigations can become more focused.
And when corrective actions can be measured against consistent historical data, reliability decisions become easier to validate.
The progression looks like this:
Consistent Capture → Structured Data → Comparable Events → Visible Patterns → Focused Investigation → Better Decisions
That is the connection between downtime standardization and root cause analysis.
The Bottom Line
Root cause analysis does not begin with a fishbone diagram, a 5 Why exercise, or an investigation meeting.
It begins with the quality of the evidence available when the investigation starts.
Standardized downtime data creates a stronger historical record by consistently separating:
where the event occurred,
what was observed,
what component failed,
and how that component failed.
It does not determine root cause automatically.
It does something more fundamental:
It gives reliability teams better evidence from which to investigate root cause.
And better evidence leads to better questions, more focused investigations, and better reliability decisions.
