
What Is MTBF? What Is MTTR? A Practical Guide for Reliability Engineers
MTBF and MTTR are two of the most widely used metrics in maintenance and reliability.
They are also two metrics that can become misleading when the underlying maintenance data is inconsistent.
A dashboard may show that MTBF is declining or MTTR is increasing, but those numbers only become useful when the events behind them are captured consistently.
Understanding what MTBF and MTTR measure—and what they do not measure—is essential for turning downtime records into useful reliability intelligence.
What Is MTBF?
MTBF stands for Mean Time Between Failures.
It measures the average operating time between repairable equipment failures.
A common calculation is:
MTBF = Total Operating Time ÷ Number of Failures
For example, suppose a debarker operates for 720 hours during a measurement period and experiences six qualifying failures.
MTBF = 720 ÷ 6 = 120 hours
The equipment therefore averaged 120 operating hours between recorded failures during that period.
What Does MTBF Tell You?
MTBF can help answer an important reliability question:
How frequently is this equipment failing?
When measured consistently over time, MTBF can help reliability teams identify changes in failure frequency.
If MTBF increases from 120 hours to 180 hours, the equipment is operating longer between failures.
If MTBF falls from 120 hours to 70 hours, failures are occurring more frequently.
That can provide an early signal that further investigation is needed.
However, MTBF does not tell you why the equipment is failing.
For that, you need the information behind the metric.
What Is MTTR?
MTTR commonly stands for Mean Time to Repair.
It measures the average amount of time required to restore equipment after a failure.
A common calculation is:
MTTR = Total Repair Time ÷ Number of Repairs
Suppose the same debarker experiences six failures requiring a combined 15 hours of repair time.
MTTR = 15 ÷ 6 = 2.5 hours
The average repair duration is therefore 2.5 hours.
What Does MTTR Tell You?
MTTR helps answer a different question:
How long does it typically take us to restore this equipment after a failure?
A rising MTTR may indicate problems involving troubleshooting, repair complexity, parts availability, accessibility, procedures, staffing, or other factors.
A declining MTTR may indicate that equipment is being restored more quickly.
But just like MTBF, MTTR does not explain the cause by itself.
An MTTR of 2.5 hours could represent very different situations depending on what actually happened during those events.
MTBF vs. MTTR
The easiest way to distinguish the two metrics is:
MTBF measures how often failures occur.
MTTR measures how long recovery from those failures takes.
Consider two pieces of equipment:
EquipmentMTBFMTTREquipment A300 hours8 hoursEquipment B100 hours1 hour
Equipment A fails less frequently, but its failures take much longer to repair.
Equipment B fails more frequently, but it returns to service relatively quickly.
Neither metric alone tells the complete reliability story.
Together, they provide a more useful picture of equipment performance.
Why MTBF and MTTR Are Not Enough
This is where maintenance data structure becomes important.
Imagine a dashboard tells you:
MTBF declined 22% over the last three months.
That tells you something changed.
It does not tell you what changed.
Now imagine the underlying downtime records contain entries such as:
Mechanical
Won't run
Bearing
Broken
Drive issue
Excessive vibration
Motor
These entries describe different types of information.
"Excessive vibration" describes an observable behavior.
"Bearing" describes a component.
"Broken" describes a failure mode.
"Mechanical" is a broad category.
"Won't run" describes an equipment condition.
When these concepts are mixed together in the same field, analyzing the events behind MTBF and MTTR becomes much more difficult.
The KPI may be mathematically correct while the underlying data provides very little diagnostic value.
The Difference Between Measuring Reliability and Understanding Reliability
MTBF and MTTR are performance indicators.
They tell you what happened at a high level.
Structured downtime data helps you investigate why it happened.
A useful reliability record may capture several separate dimensions of an event:
Equipment Hierarchy → Observable Behavior → Failed Component → Failure Mode
For example:
Debarker → Drive System → Excessive Vibration → Bearing → Worn
Now the organization can go beyond asking:
Why did MTBF decrease?
It can begin asking:
Which equipment is driving the decrease?
Which subsystems are experiencing the most failures?
What behaviors are operators observing?
Which components are failing most frequently?
Which failure modes are recurring?
Which events are consuming the most repair time?
That is a much stronger foundation for reliability analysis.
The Same Problem Applies to MTTR
Suppose your dashboard shows:
MTTR increased from 2.1 hours to 3.4 hours.
The increase is important.
But the average alone does not tell you whether the change came from:
longer bearing replacements,
repeated troubleshooting,
difficult-to-access components,
a particular subsystem,
several unusually long events,
or a different mix of failure types.
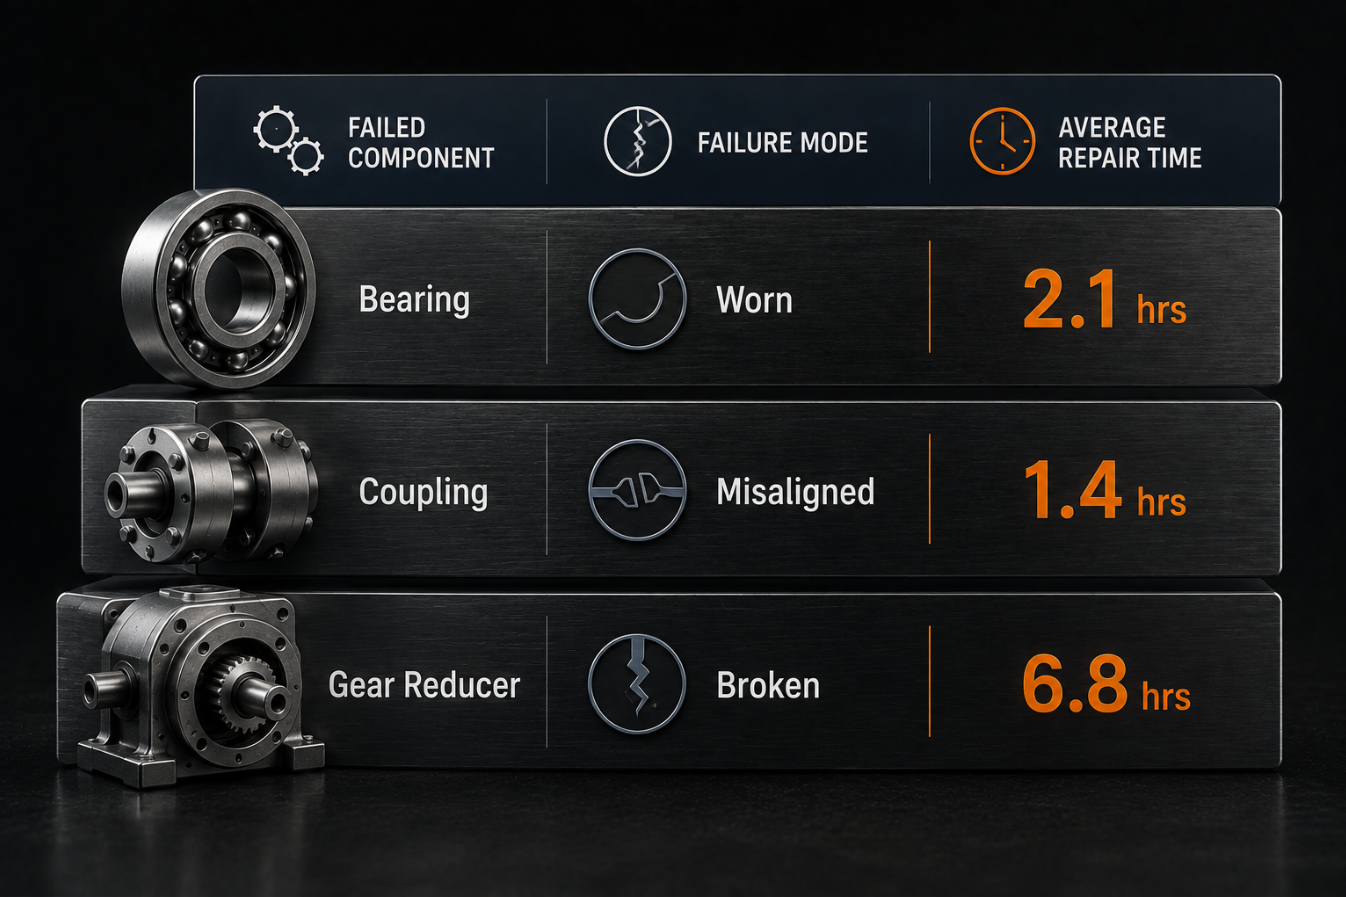
If failed components and failure modes are captured consistently, the organization can segment MTTR rather than relying only on the overall average.
For example:
Data Standardization Matters
Consider what happens when different people describe the same condition differently:
Won't Start
Failed to Start
Wouldn't Start
No Start
Dead
A person reading the records may recognize that these descriptions are similar.
A dataset may treat them as five separate values.
The same problem occurs with equipment names, components, and failure modes.
One person may enter:
Drive Motor
Another:
Motor
Another:
Debarker Motor
Another:
Main Drive
If those records refer to the same component, the resulting analysis becomes fragmented.
That fragmentation affects the organization's ability to understand the events influencing MTBF and MTTR.
Better KPIs Start With Better Data
Reliability dashboards are often treated as the final step in the reliability data process.
In reality, the quality of the dashboard begins much earlier.
It begins with how equipment is structured.
It continues with how downtime events are classified.
And it depends on whether the same terminology is used consistently from one event to the next.
A stronger data structure might look like:
Equipment
Where did the event occur?
↓
Observable Behavior
What did the operator observe?
↓
Failed Component
What component was determined to have failed?
↓
Failure Mode
How did that component physically fail?
↓
Downtime and Repair Duration
How long was production affected, and how long did restoration take?
↓
Reliability Metrics
MTBF, MTTR, Pareto analysis, trends, and other KPIs.
The metrics sit at the top of the structure.
The standardized event data underneath them is what makes those metrics actionable.
A Note About Definitions
Organizations should define exactly how MTBF and MTTR are calculated before comparing results across equipment, departments, sites, or reporting systems.
For example, teams should agree on questions such as:
What qualifies as a failure?
Which equipment states count as operating time?
When does repair time begin?
When does repair time end?
Are planned maintenance events excluded?
How are overlapping downtime events handled?
Are all assets using the same definitions?
Without consistent definitions, two sites can calculate metrics called "MTBF" or "MTTR" differently and reach different conclusions.
Consistency in the calculation is just as important as consistency in the underlying data.
MTBF and MTTR Are Signals, Not Diagnoses
MTBF and MTTR are valuable because they simplify complex equipment performance into understandable indicators.
But neither metric should be mistaken for a root-cause analysis.
MTBF tells you how frequently failures are occurring.
MTTR tells you how long restoration is taking.
Structured reliability data helps you understand what is driving those numbers.
That distinction matters.
A reliability program becomes much more powerful when it can move from:
"Our MTBF is getting worse."
to:
"Our MTBF is getting worse because repeated bearing failures in this subsystem are increasing, and excessive vibration is the most frequently recorded behavior preceding those events."
The first statement identifies a problem.
The second provides direction.
The Bottom Line
MTBF and MTTR are important reliability metrics, but the calculations themselves are relatively simple.
The difficult part is building trustworthy information underneath them.
Reliable analysis requires consistent definitions, standardized equipment structures, and clearly separated downtime data such as observable behaviors, failed components, and failure modes.
When that foundation exists, MTBF and MTTR stop being isolated dashboard numbers.
They become gateways into understanding equipment performance.
Better metrics begin with better data.
